


A quick snapshot of what we've built

Current mood-tracking methods meet some challenges
There are two common ways that people track their mood, one is self-assessment questionnaires like PHQ-9 and GAD-7, and the other is mood-tracking app, such as Daylio and Finch, which are the two frequently-use apps in our user interview.

Mood-tracking retention drops from 12% to 5.7% in 30 days, as manual input quickly becomes unsustainable.

Existing apps offer limited emotion options, making it hard for users to express nuanced feelings accurately.

Apps show mood history but fail to link emotions to lifestyle factors, leaving users unsure how to improve.

Complex forms and frequent notifications overwhelm users, discouraging consistent mood tracking.


We decided to automate mood tracking by using physiological data to estimate user’s mood state.

Wearable Device


Collect Biometric Data

Acquire Data by API

Estimate Mood by ML model


Visualize Mood Result on Phone
We built a prototype to visualize the mood estimation result.


However, user testing challenged our initial hypothesis.
Through user testing, we found that users didn’t trust our mood-estimation approach. Instead, they concerns around trust, meaning, and emotional connection:


Learning from users, we took a step back and reframed our focus.


With the new design focus, we went through several rounds ideation and validation.


Home Hub captures emotional context and nuances.
Our Home Hub is designed to capture complex emotions by analyzing speech data, users can log their mood by simply talking about their day, and they can get the emotional summary on the mobile app.


9:41
Mood Report
Daily Topic
Summary
(generated by AI)
Mood Breakdown
(understand proportion)
Mood Triggers
(categorized by factors, e.g. location, people, event)
Different tone with the same words can lead to different meanings. We connect our Home Hub with Hume.ai API to further analyze user’s voice expression.


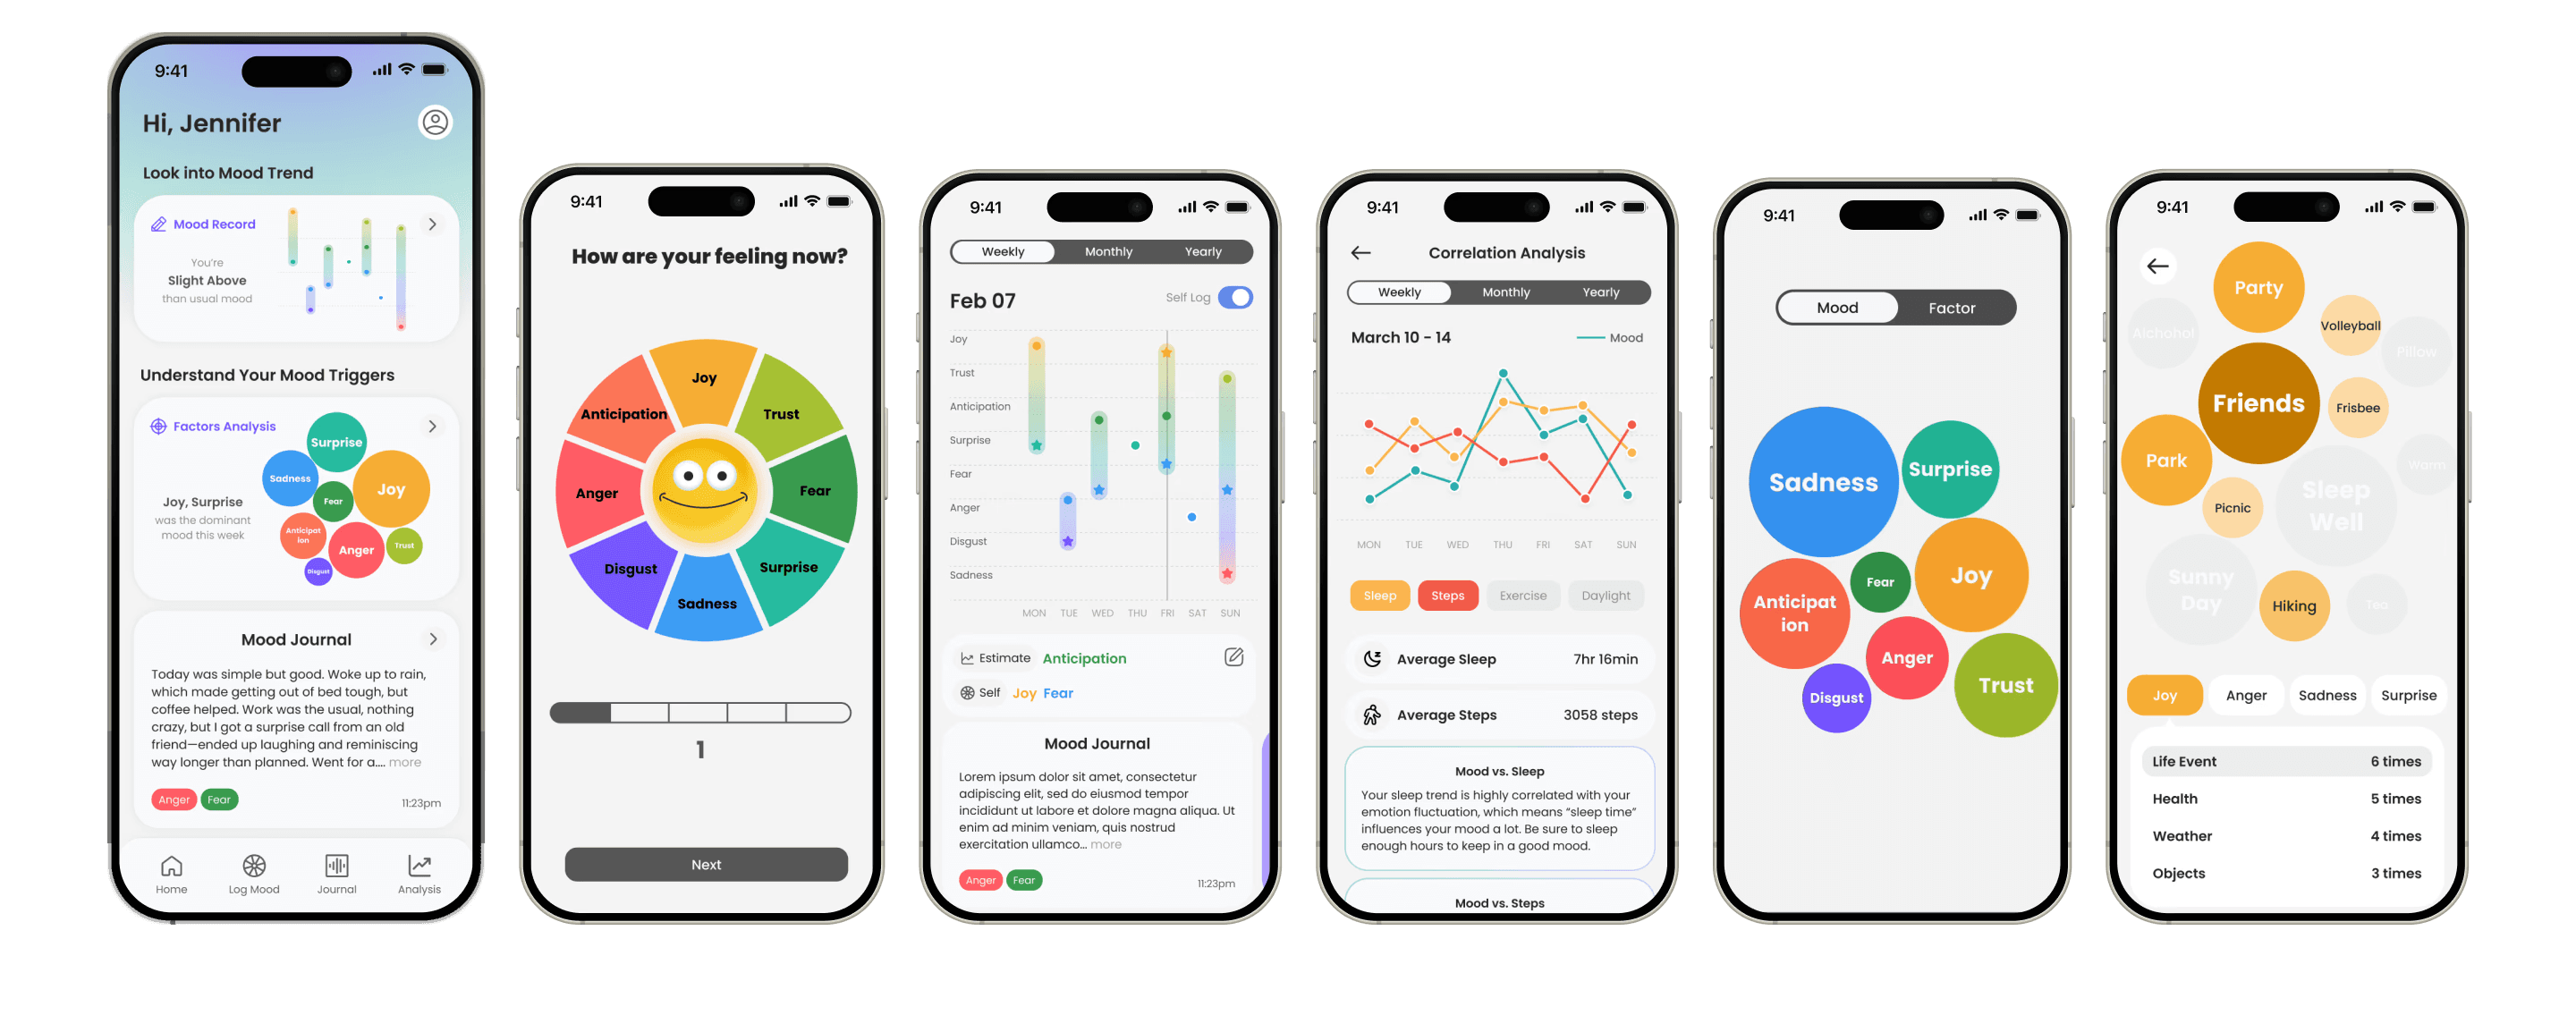
We designed the Mood Cloud to visualize how users’ emotions evolve over time.
Mood cloud will evolve over time as each different emotions detected. Users can also view it by the “factor” category, helping them identify mood triggers in an interactive way.

9:41

9:41

9:41

9:41
This video shows how the Home Hub actually works
Mood dashboard presents mood data points.
Three data sources were combined to display in one place for better comparison
Mood Journal & Supplementary Info
(Summary from Home Hub data)


We iterated the mood visualization to better represent multiple types of emotional data.
Version 1
Average mood score line
Line graph for adjustments
Version 2
Emotion-specific markers
Continuous mood points

Version 3
Stacked bar graph
Discrete mood points

Single mood number oversimplified emotional states. Users wanted to see more detailed mood fluctuations across different emotions.
Mood states on different days are distinct and multi-layered. Users wanted a clearer way to compare multiple emotions over time.
We also correlated mood patterns with lifestyle factors for better management


Theory-based mood wheel for logical mood logging.
To parse complex emotions in a logical and scientific way, we applied Plutchik’s Circumplex Model of Emotions to design the mood wheel, helping users identify eight primary emotions, understand intensity levels, and visualize emotional combinations.

8 Primary Emotions
5 Intensity Levels


9:41

We created playful emotion characters to represent the eight core moods, making mood logging more engaging and interactive.


some emojis credit to Raz Rashid
Behind the scene...
Over six months, we progressed from problem definition and concept development to prototyping and technical implementation. The process was grounded in solid user research and iterative design, making the system both comprehensive and expert-backed.


What I Learned...


Early assumptions about automation were overturned by real user feedback, reminding me I should be open to pivoting when research reveals deeper user needs.
Multiple rounds of iteration to simplify complex emotional information taught me that a good visualization isn't about showing everything—it's about showing what matters.

Designing for mental health reminded me that UX isn’t just about usability; it’s about emotional resonance. Tone, wording, and emotional context all shape trust, comfort, and engagement.